Standalone App
Data Mapping
A comprehensive mapping helps nepExplorer correctly interpret your clinical trial datasets. To ensure your data is compatible with nepExplorer and you can effectively utilize its features, please see the following link for detailed information about required data domains, data format, and specific column requirements: Data and Settings Guidelines. This resource provides a comprehensive guide to preparing your data for analysis and visualization within nepExplorer.
custom_map <- list(
  vitals = list(
    "id_col" = "USUBJID",          # Unique subject identifier
    "measure_col" = "TEST",         # Vitals measure variable
    "value_col" = "STRESN",      # Vitals result value
    "unit_col" = "STRESU",       # Unit of measure
    "visit_col" = "VISIT",         # Visit name
    "visitn_col" = "VISITN",     # Visit number
    "studyday_col" = "DY",       # Study day
    "baseline_flag" = "BLFL",  # Baseline flag column
    "baseline_values" = list("Y" = "TRUE"), # Baseline value
    "measure_values" = list(
      "SYSBP" = "Systolic Blood Pressure (mmHg)",
      "DIABP" = "Diastolic Blood Pressure (mmHg)"
    )
  ),
  labs = list(
    "id_col" = "USUBJID",
    "measure_col" = "TEST",
    "value_col" = "STRESN",
    "unit_col" = "STRESU",
    "studyday_col" = "DY",
    "visit_col" = "VISIT",
    "visitn_col" = "VISITN",
    "baseline_flag" = "BLFL",
    "baseline_values" = list("Y" = "TRUE"),
    "normal_col_high" = "STNRHI",
    "measure_values" = list(
      "nepFC_ALB" = "Albumin (mg/dL)",
      "ALB/CREAT" = "Albumin/Creatinine",
      "nepFC_BICARB" = "Bicarbonate (umol/L)",
      "nepFC_BUN" = "Blood Urea Nitrogen (mmol/L)",
      "BUN/CREAT" = "Blood Urea Nitrogen/Creatinine",
      "nepFC_CA" = "Calcium (mmol/L)",
      "nepFC_CL" = "Chloride (mmol/L)",
      "CREAT" = "Creatinine (mg/dL)",
      "CYSTC" = "Cystatin C (umol/L)",
      "eGFR" = "eGFR (mL/min)",
      "eGFRcys" = "eGFRcys (mL/min)",
      "nepFC_PHOS" = "Phosphate (mmol/L)",
      "nepFC_K" = "Potassium (mmol/L)",
      "nepFC_SODIUM" = "Sodium (mmol/L)"
    )
  ),
  dm = list(
    "id_col" = "USUBJID",
    "treatment_col" = "ARM"
  )
)
Launch App
create_nepexplorer_app(
  data = list(
    dm = nepExplorer::adsl,        # Demographic data
    labs = nepExplorer::adlb,      # Laboratory measurements
    vitals = nepExplorer::advs     # Vital signs
  ),
  mapping = custom_map
)
Configuration Guide
Required Fields
-
id_col: Unique subject identifier -
measure_col: Measurement type column -
value_col: Numeric result column -
unit_col: Measurement units -
visit_col: Visit name -
visitn_col: Visit number -
studyday_col: Study day -
baseline_flag: Baseline identification column -
baseline_values: Value inbaseline_flagcolumn indicating a baseline record
Required Lab Test
-
Creatinine: Creatinine is a required lab test collected inmeasure_col. It must be in conventional units.
Integrating nepExplorer with safetyGraphics
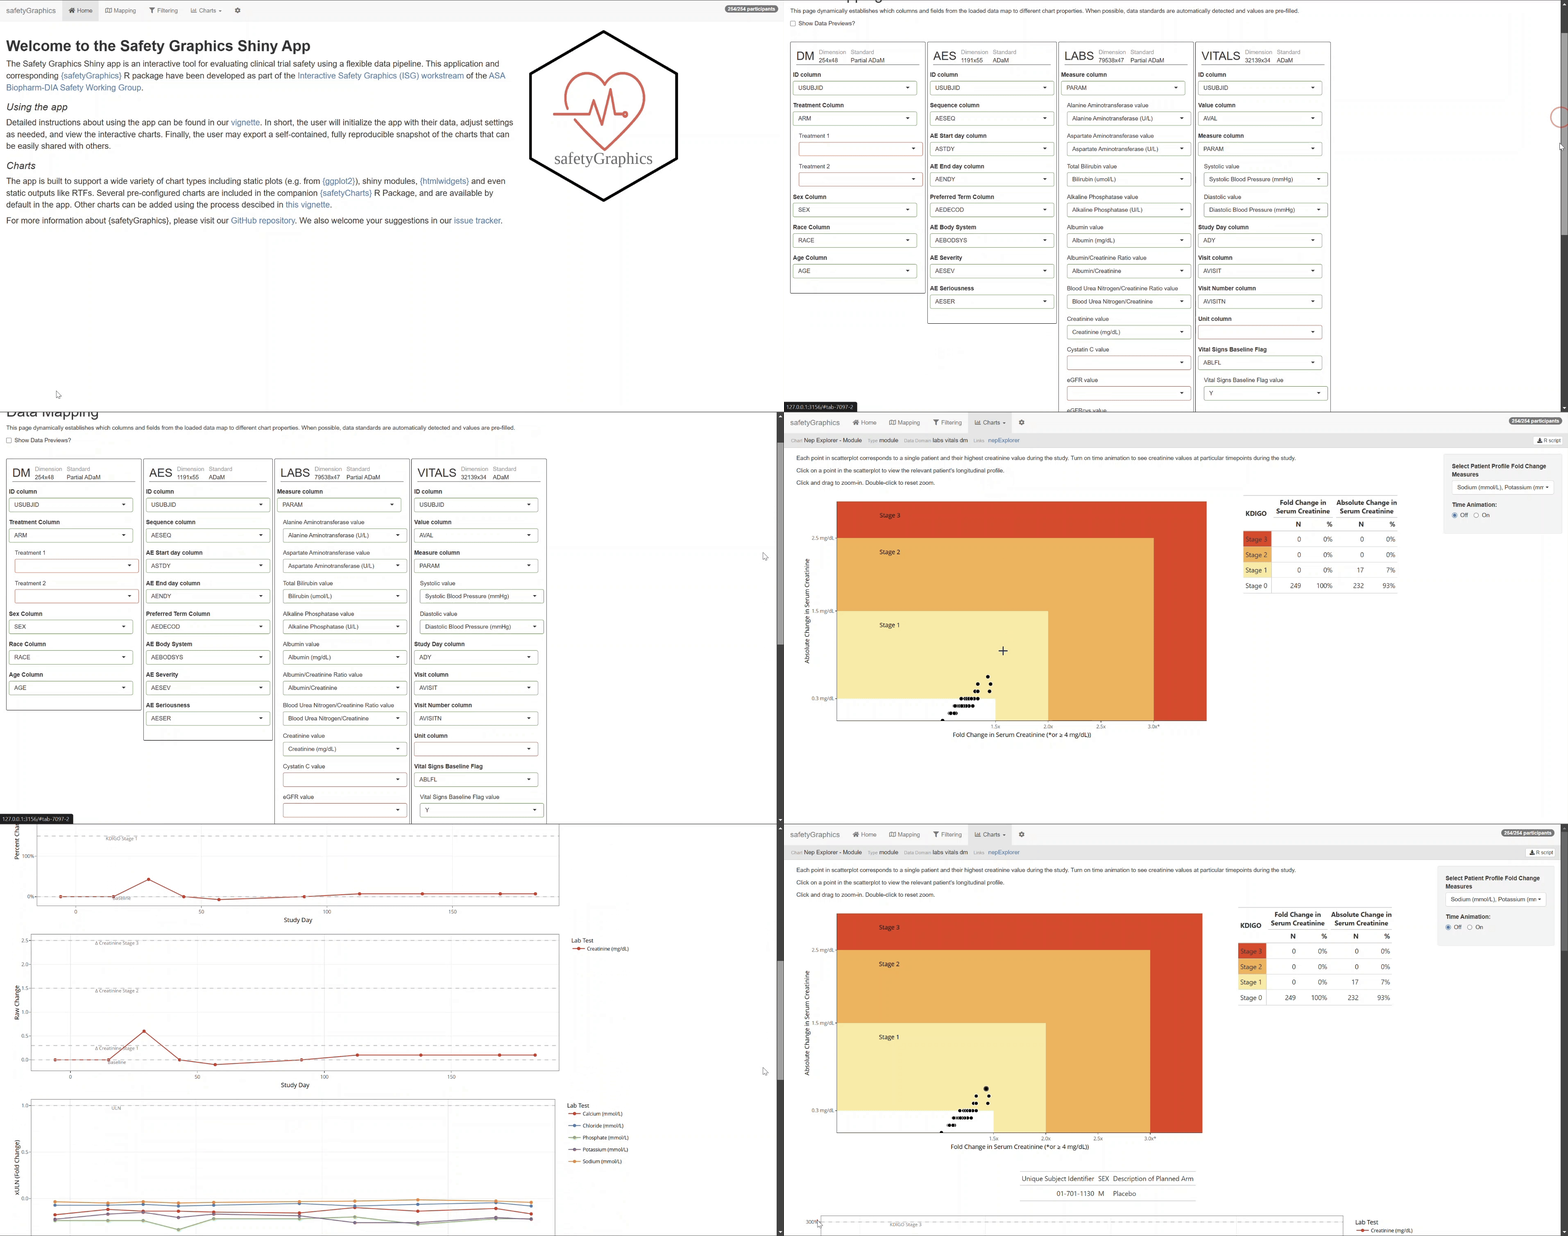
This nepExplorer charts can be added to the {safetyGraphics} shiny app, which allows us to create the charts with any mappings/data combination loaded in the app. The configuration will be captured in a YAML file.
env: safetyGraphics
label: Nep Explorer - Module
name: nepexplorerMod
type: module
package: nepExplorer
order: 9
domain:
  - labs
- vitals
- dm
workflow:
  ui: nepexplorer_ui
server: nepexplorer_server
links:
  nepExplorer: https://github.com/SafetyGraphics/nep-explorer
With the nepExplorer loaded in to our session and the configuration file saved in our working directory as nepExplorer.yaml, we can add the charts to the safetyGraphics application as follows:
library(nepExplorer)

library(yaml)

charts <- c(
  safetyGraphics::makeChartConfig(),
  safetyGraphics::makeChartConfig(
    packages = "nepExplorer",
    packageLocation = "./inst/config", # location of nepExplorer.yaml file
    sourceFiles = TRUE
  )
)

charts$nepexplorerMod$meta <- nepExplorer::meta_nepExplorer

safetyGraphics::safetyGraphicsApp(
  domainData = list(
    labs = safetyData::adam_adlbc,
    dm = safetyData::adam_adsl,
    vitals = safetyData::adam_advs
  ),
  charts = charts
)
Configuring the Mapping Tab
After launching the safetyGraphics app with nepExplorer integration:
Navigate to the Mapping tab in the user interface
Configure the following required mappings:
All required variables must be correctly mapped for nepExplorer visualizations to work properly. Refer to the detailed mapping guidelines for specific requirements.
After completing the mapping, switch to the Charts tab to view the nepExplorer visualizations

For a complete tutorial on safetyGraphics mappings, see the safetyGraphics ChartConfiguration.