Intro Vignette
The safetyGraphics shiny app provides an easy-to-use shiny interface for creating shareable safety graphics for any study. This vignette provides an overview of the app’s functionality, shows how to initialize the app with your own study data, and provides links to technical resources explaining how to customize the app.
safetyGraphics Demo
A demo of shiny application using data from the {safetyData} package is hosted here. The app can also be initialized with the safetyGraphicsApp() function in the R console - see Appendix 1 for details.
Let’s take a quick look at the various pages in the app.
Mapping Tab
The Mapping tab is used to tell charts which data columns and fields to use for various chart components.
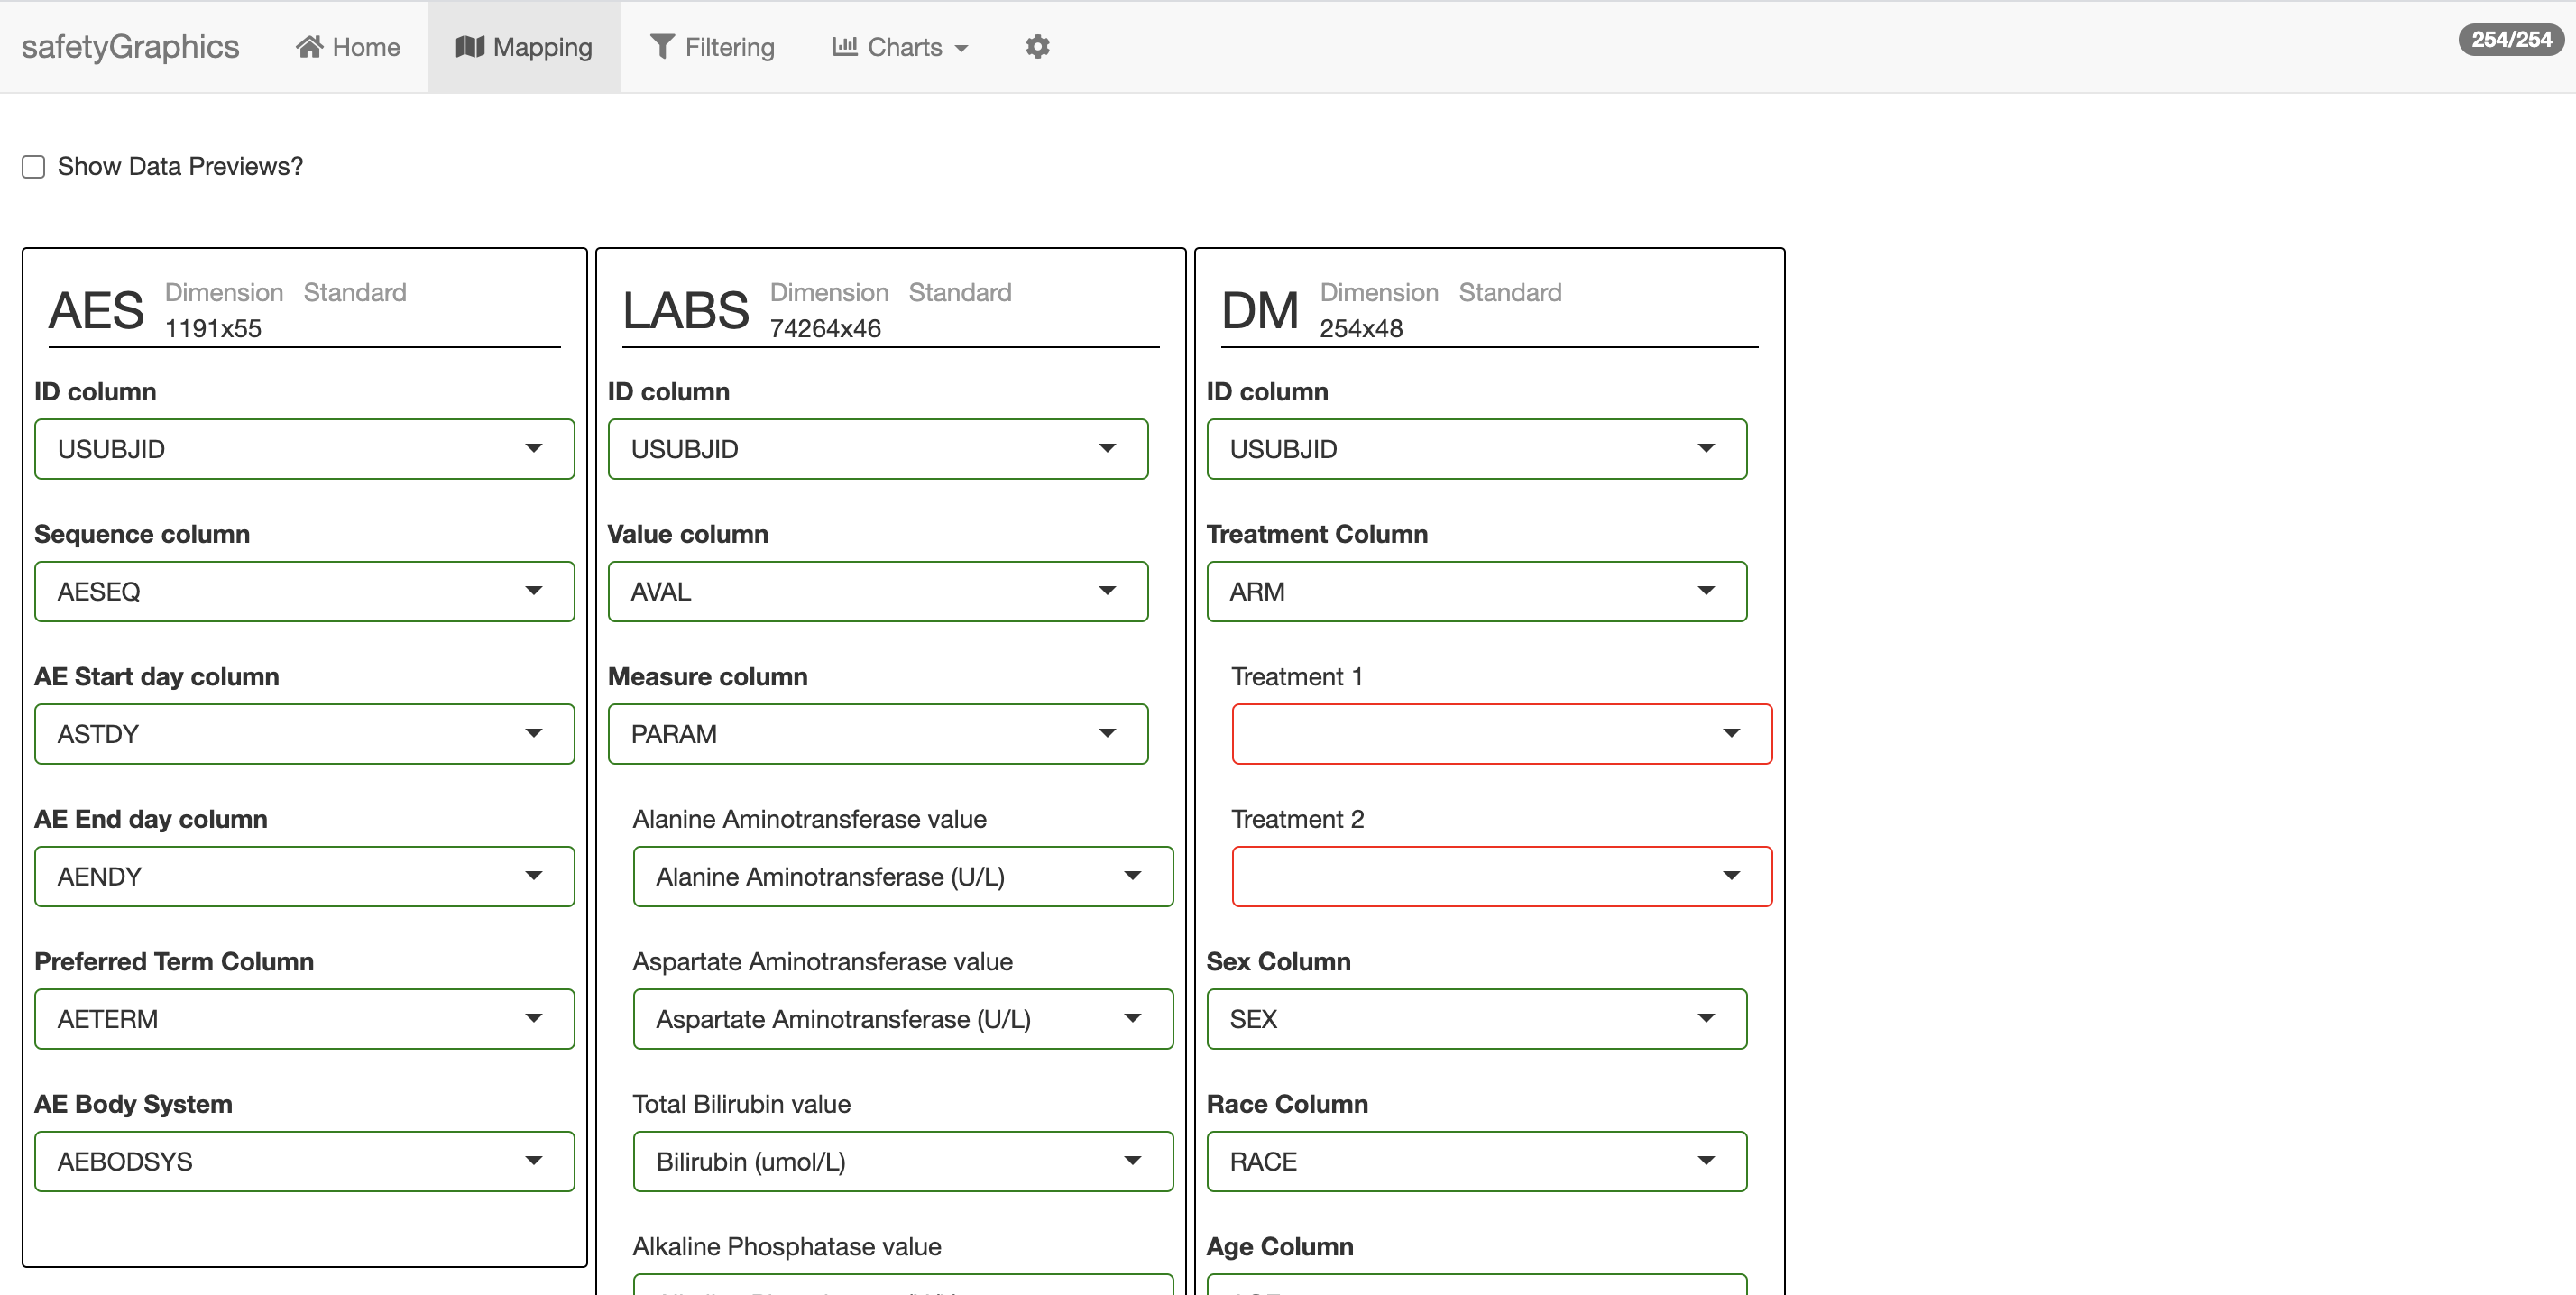
This mapping process makes it easy to re-use charts across many different studies. You can see previews of the loaded data using the checkbox at the top of the page. The demo data has 3 data domains (labs, adverse events (aes) and demographics (dm)), but others can be added as well. The mapping tab is automatically filled in for common data standards, like the ADaM data shown here, but can also be filled in manually for non-standard data.
Filtering Tab
The Filtering tab allows users to interactively select which participants to include in charts.
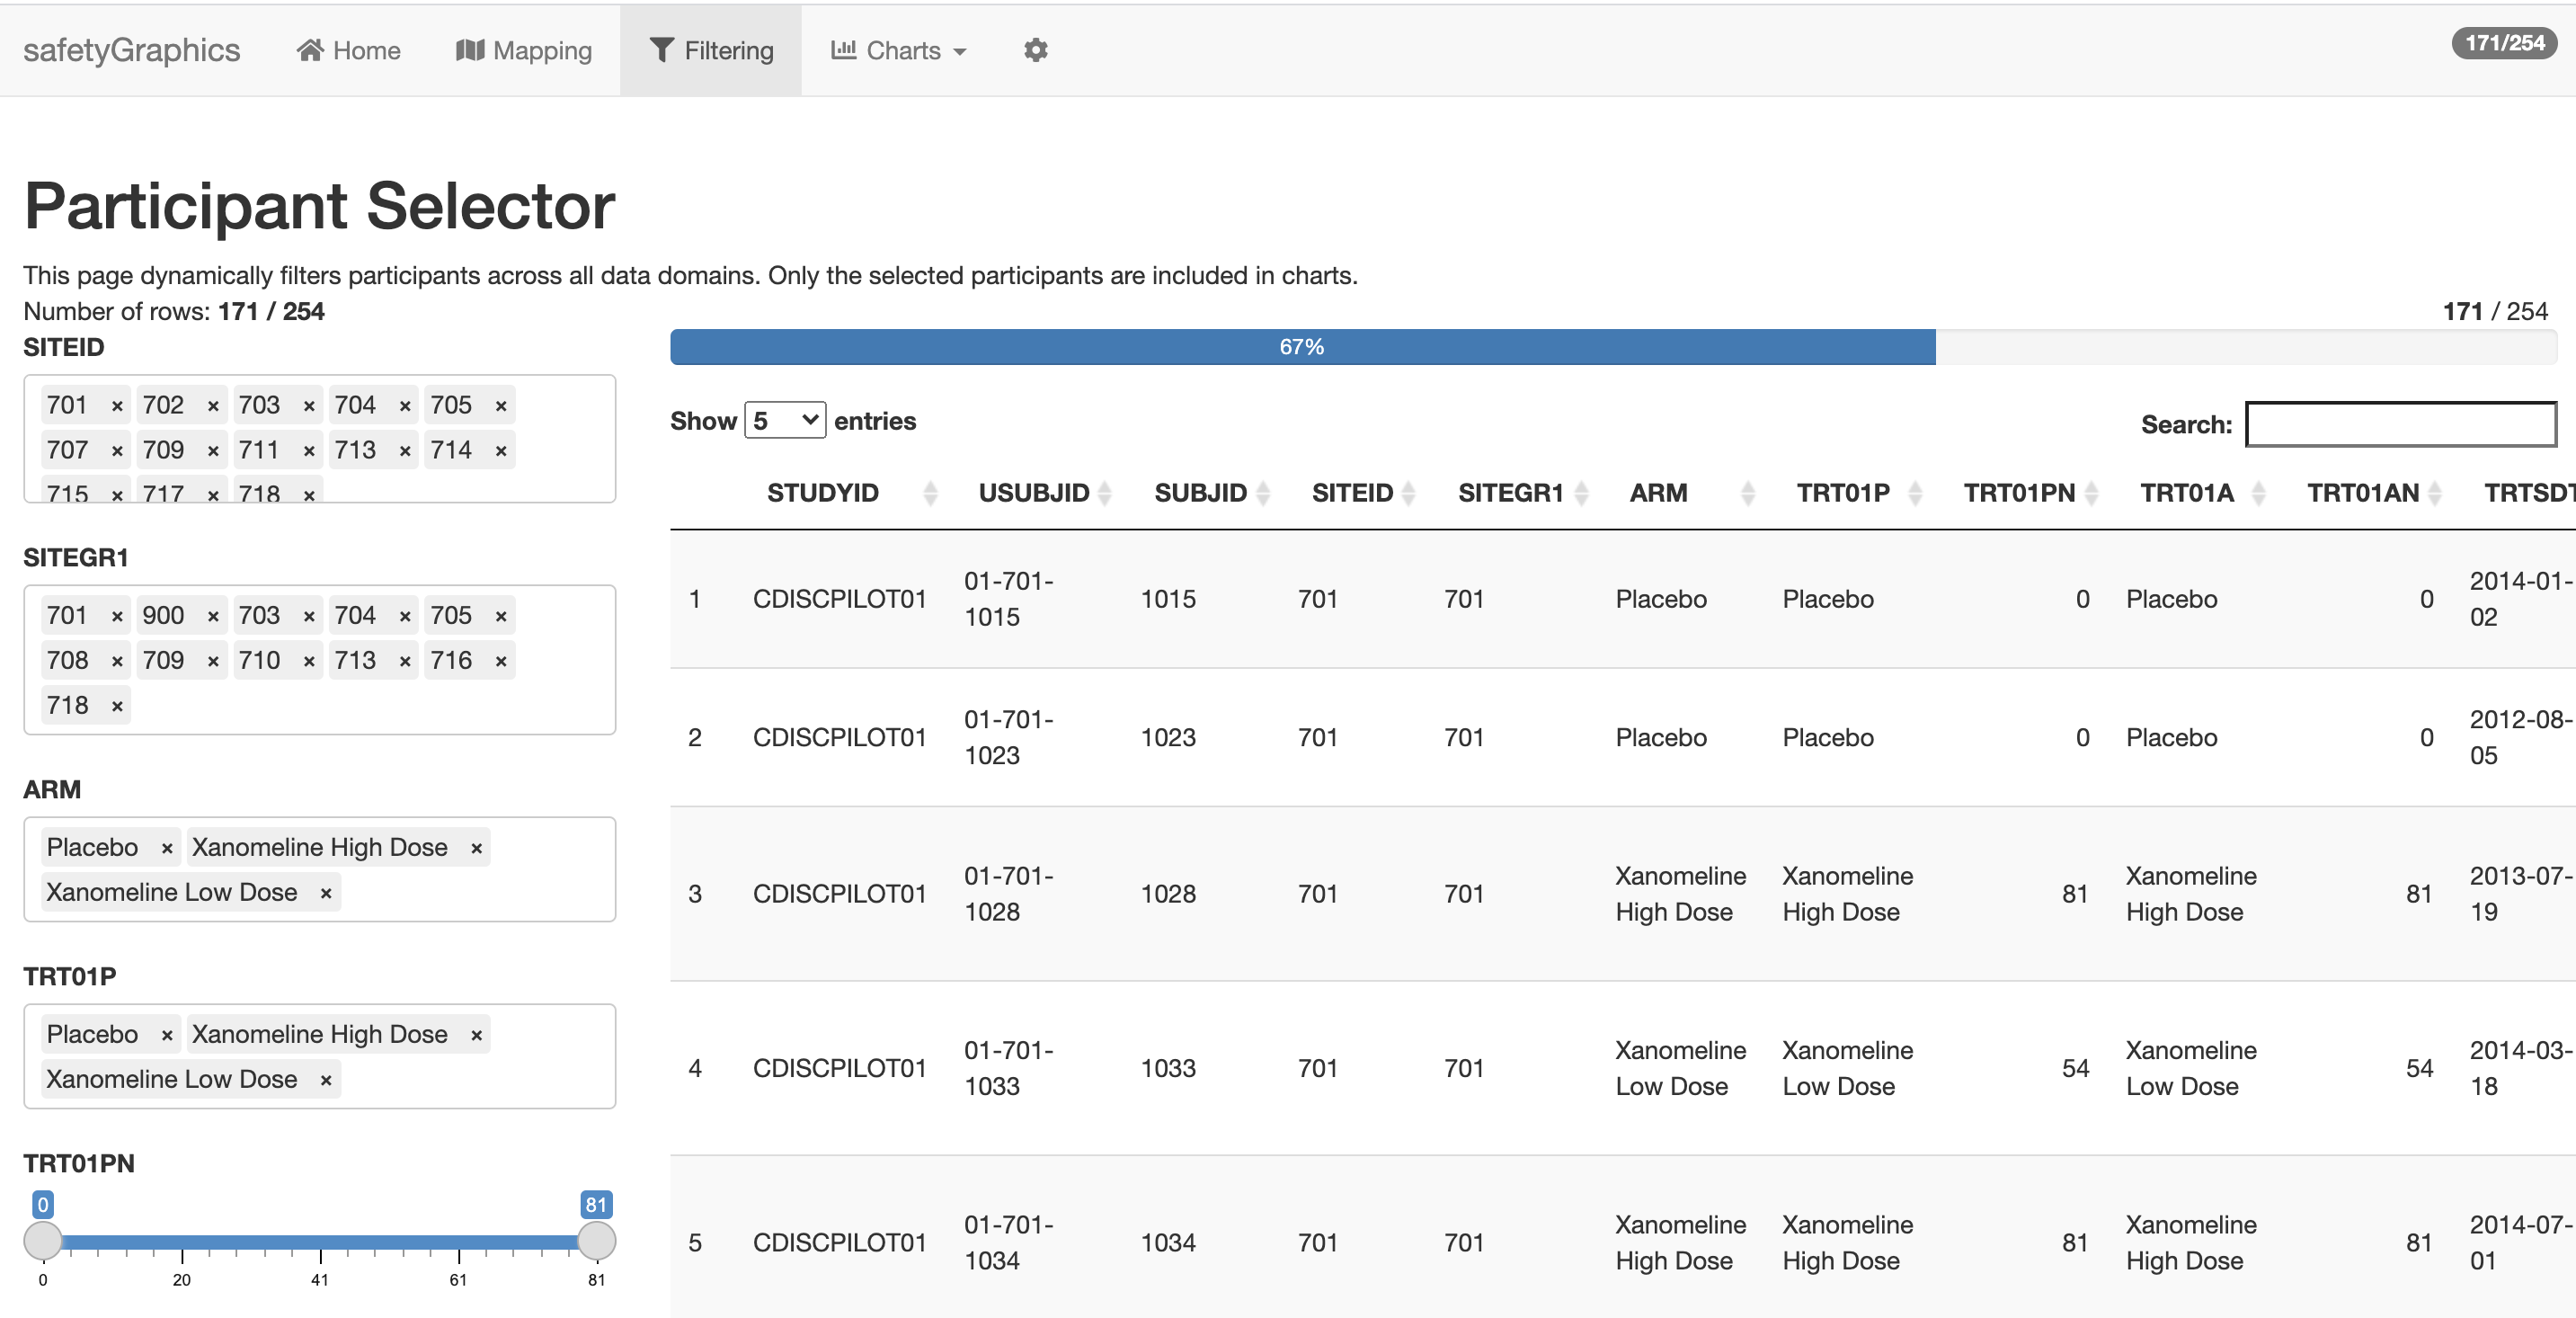
This tab is created using the filter functionality included in the {datamods} package. Whenever data is filtered in this tab, those filtered data are used in all charts (across all data domains). Note that the number of participants selected is always shown in the upper right hand corner of the app.
Charts Tab
Clicking the Charts tab opens a dropdown menu containing a series of charts related to clinical trial safety. Clicking the Hepatic Safety Explorer opens this page:
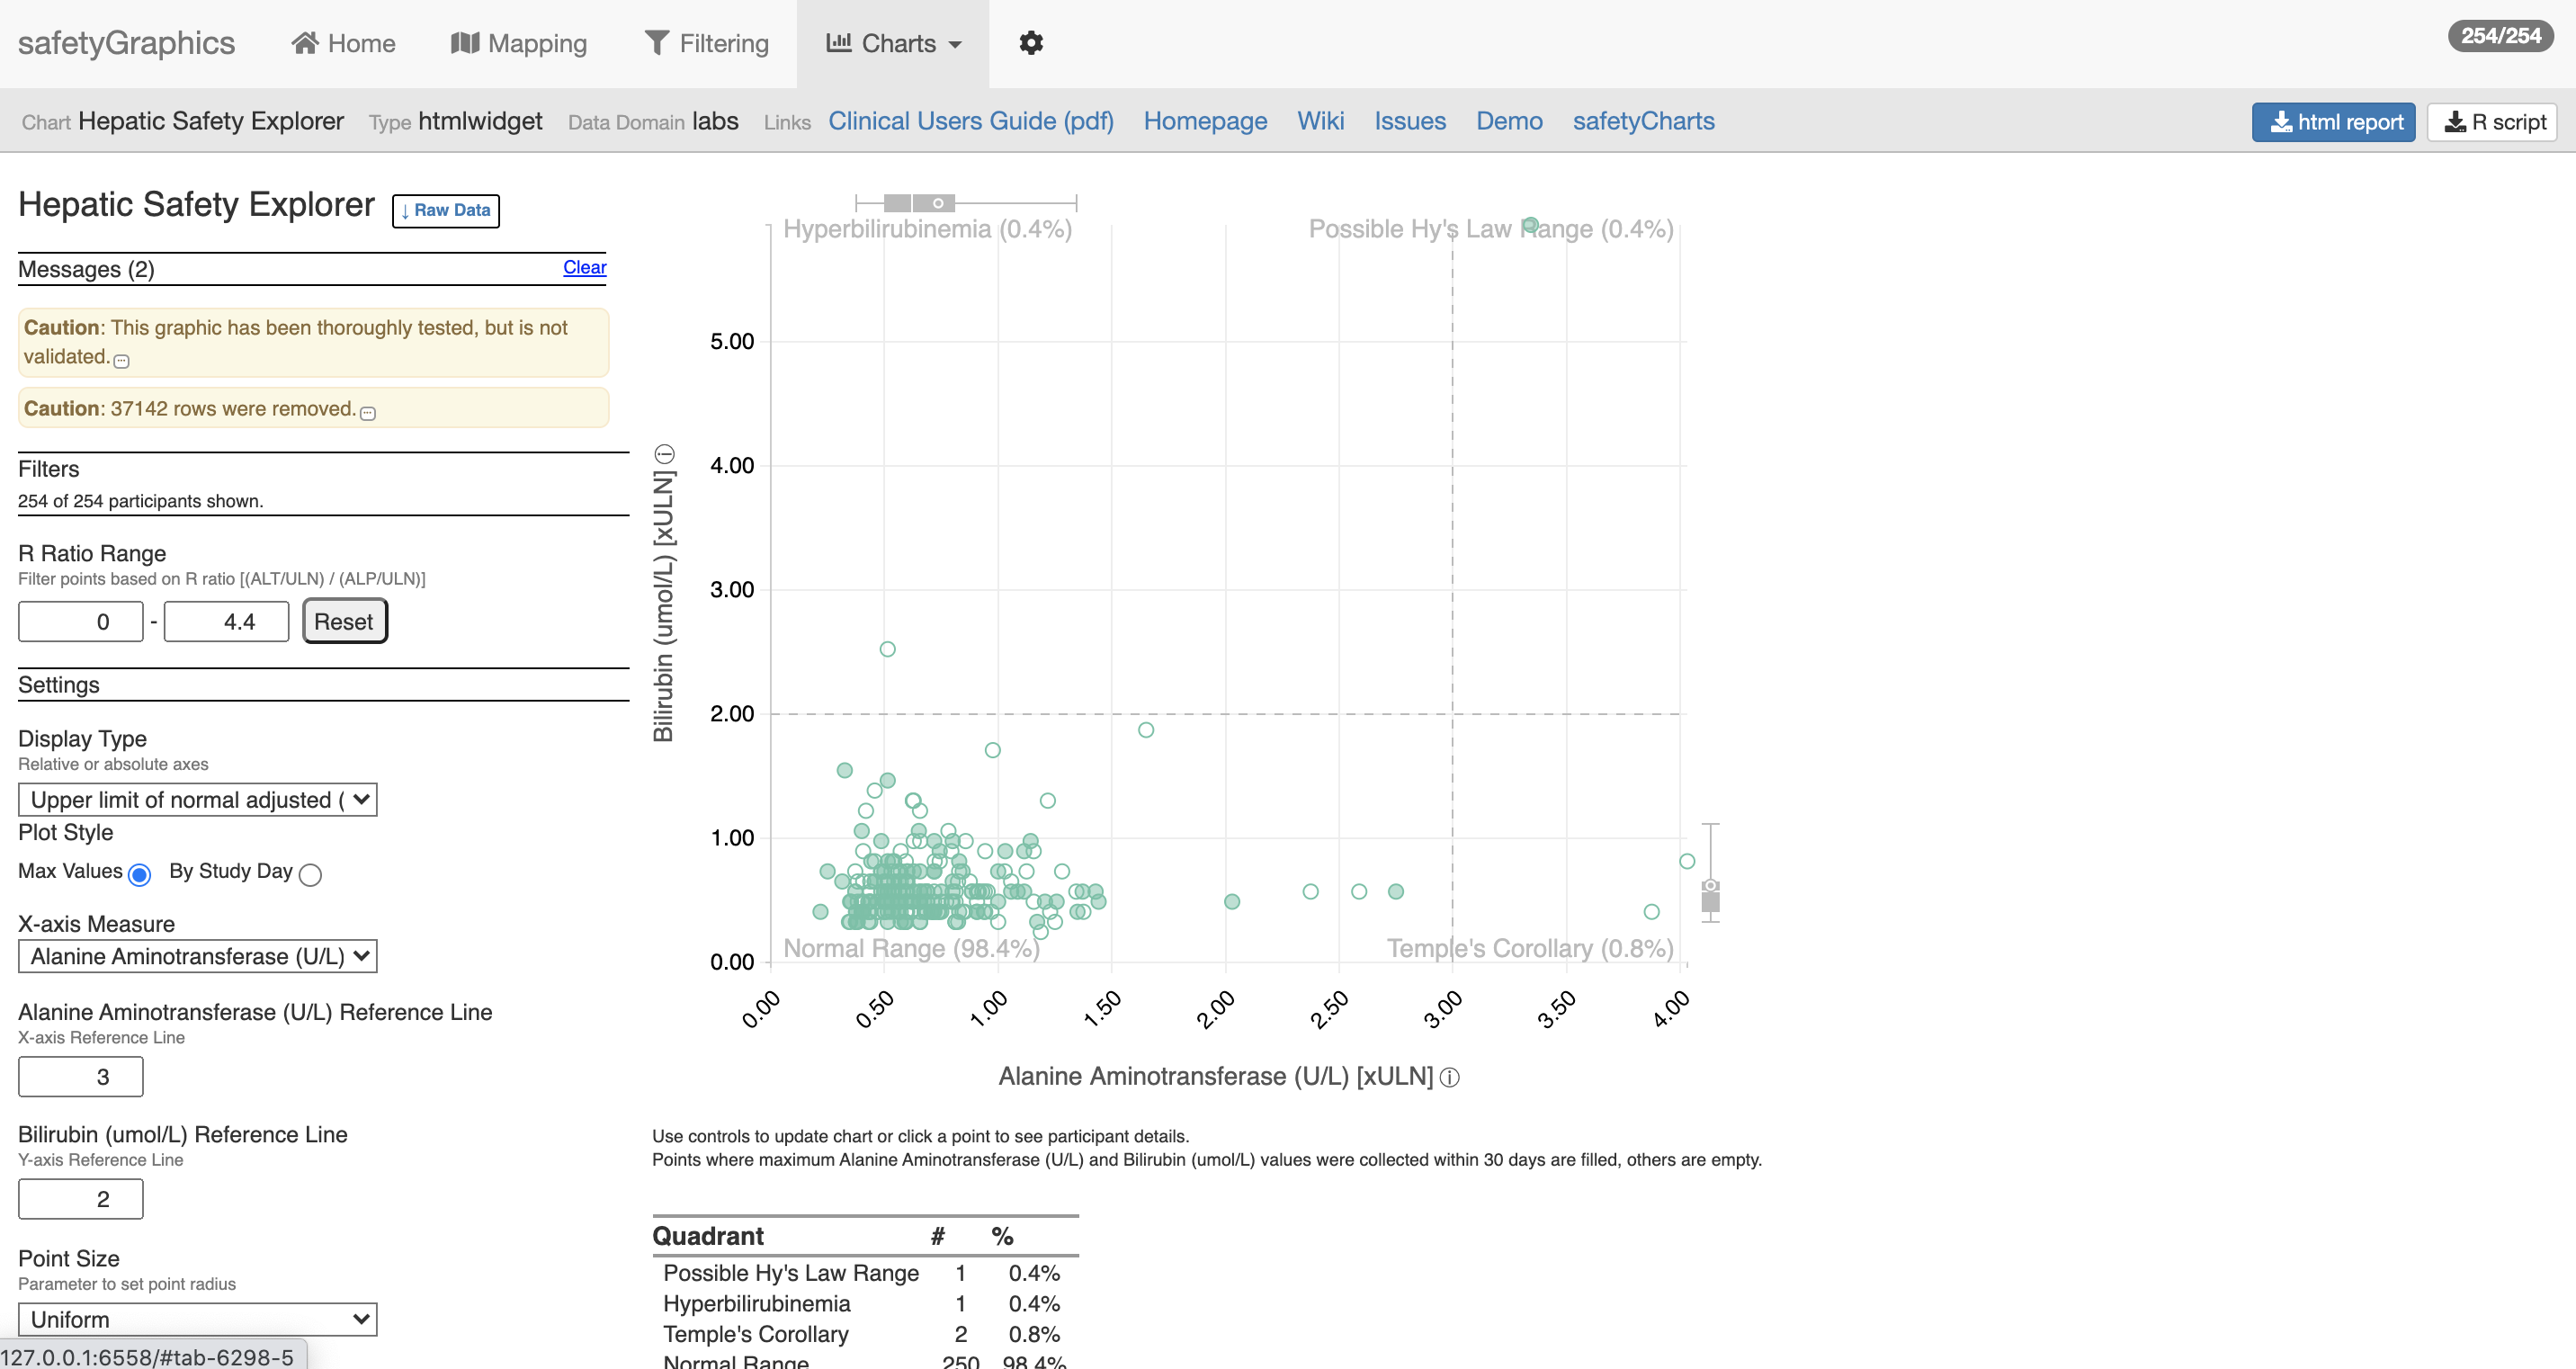
safetyGraphics supports many different kinds of charts including web-based interactive graphics using {htmlwidgets} (like the chart shown above), static plots, plotly plots and custom shiny modules. Each chart has a header that provides details about the chart, links to chart-specific resources and buttons that allow users to download a stand-alone html report or a .R file that reproduces the chart. See the Chart Configuration Vignette for more detail about the safetyGraphics charting framework.
⚙️ (Settings) Tab
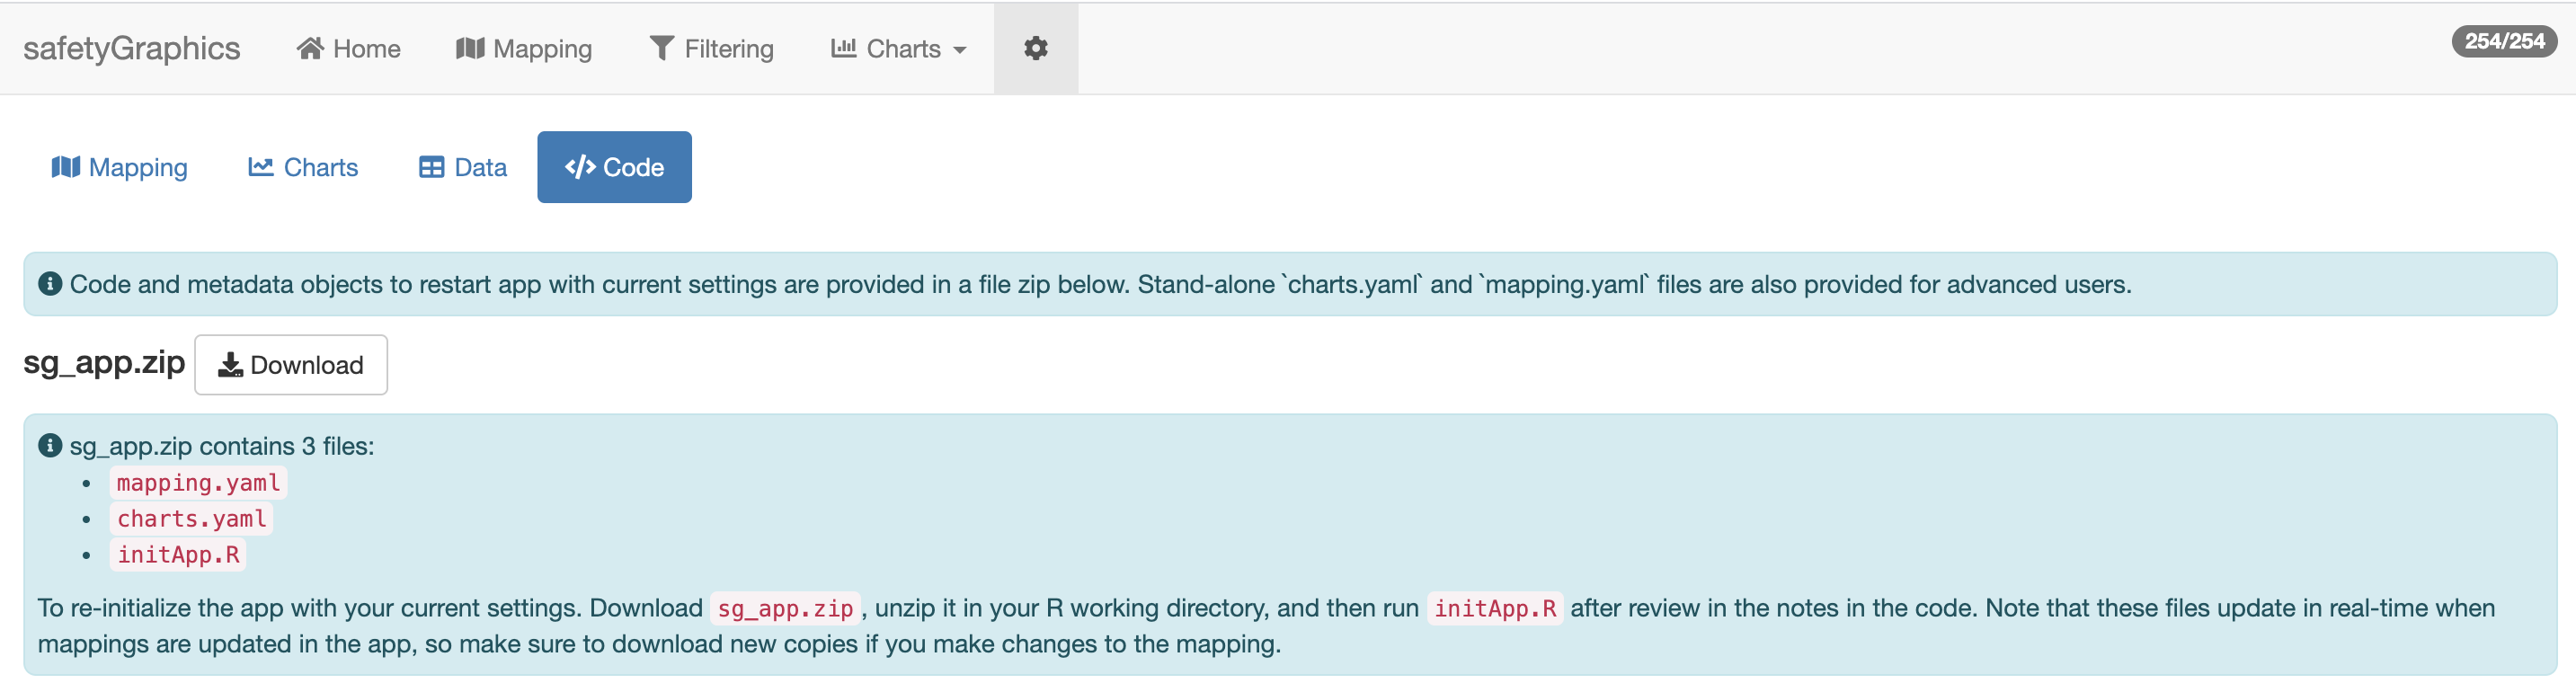
Finally, the Settings tab - shown as a gear icon ⚙️ - contains technical details that can be used to customize/troubleshoot the app. Clicking on the “Code” sub-tab (shown below) allows you to download a zip file that can be used to re-open the app with with any customizations that have been made during your current session.
Loading Study Data
safetyGraphics supports a wide range of data formats and standards. Generally speaking, any clinical data can be loaded as long it meets the minimal data requirements described in appendix 2.
There are 2 primary ways to load your study data in to the safetyGraphics shiny app:
- Using
safetyGraphicsInit()shiny interface - Passing data directly to
safetyGraphicsApp()
Loading data with safetyGraphicsInit()
The safetyGraphicsInit() function starts a simple app that allows users to select charts and then load the data required via a point-and-click interface as shown below:
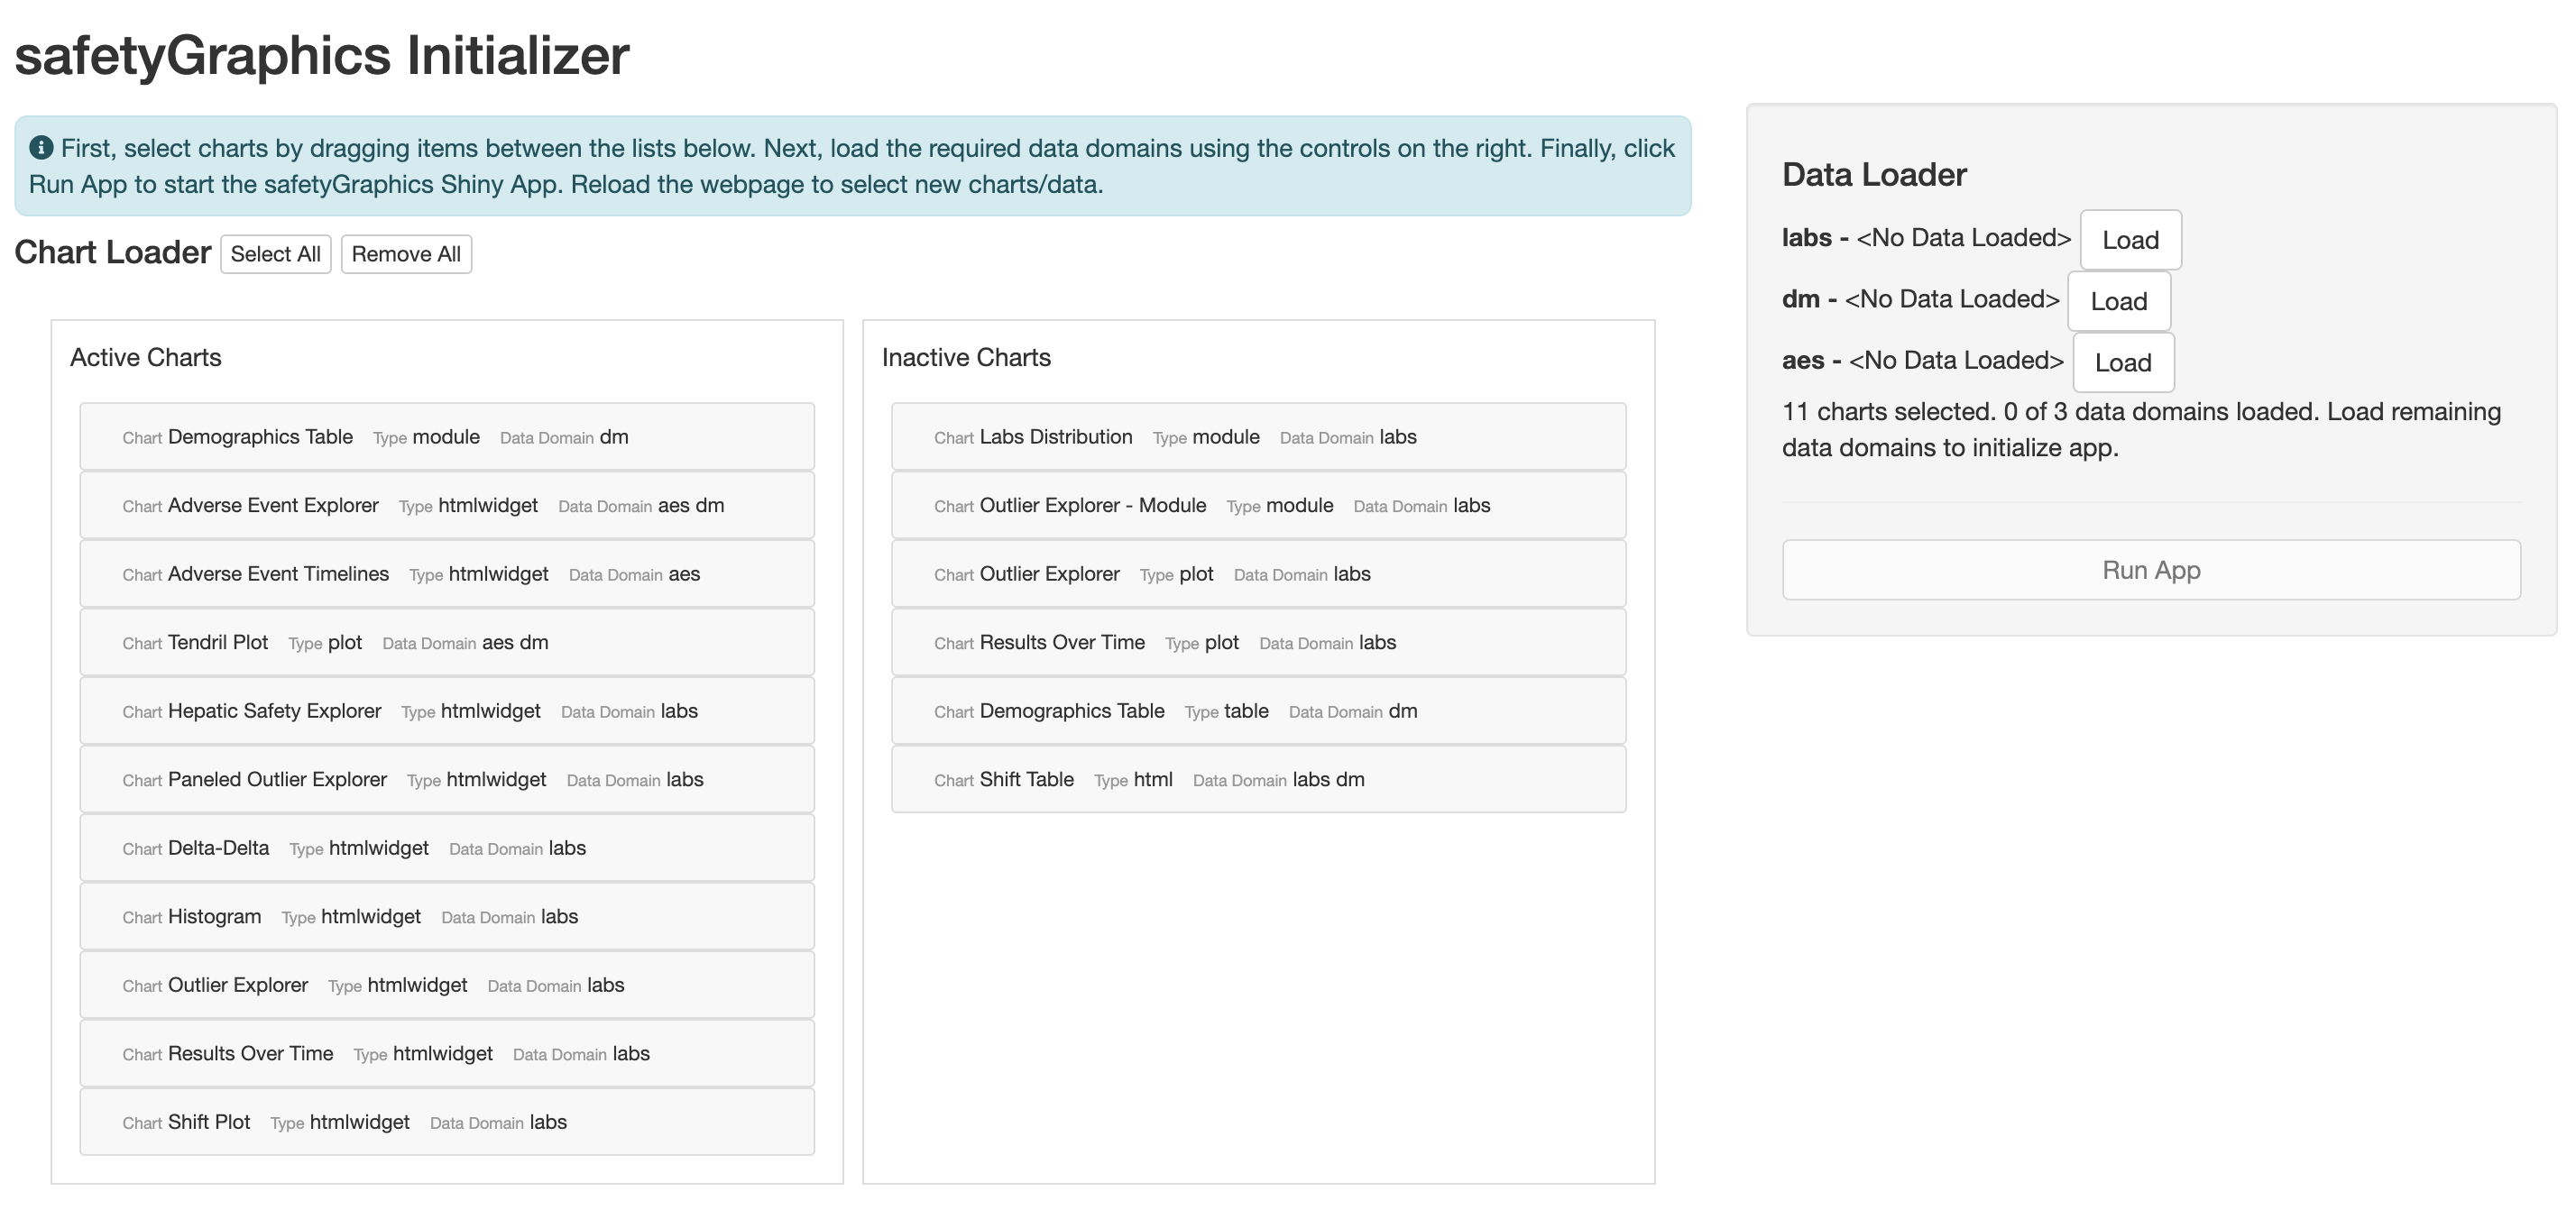
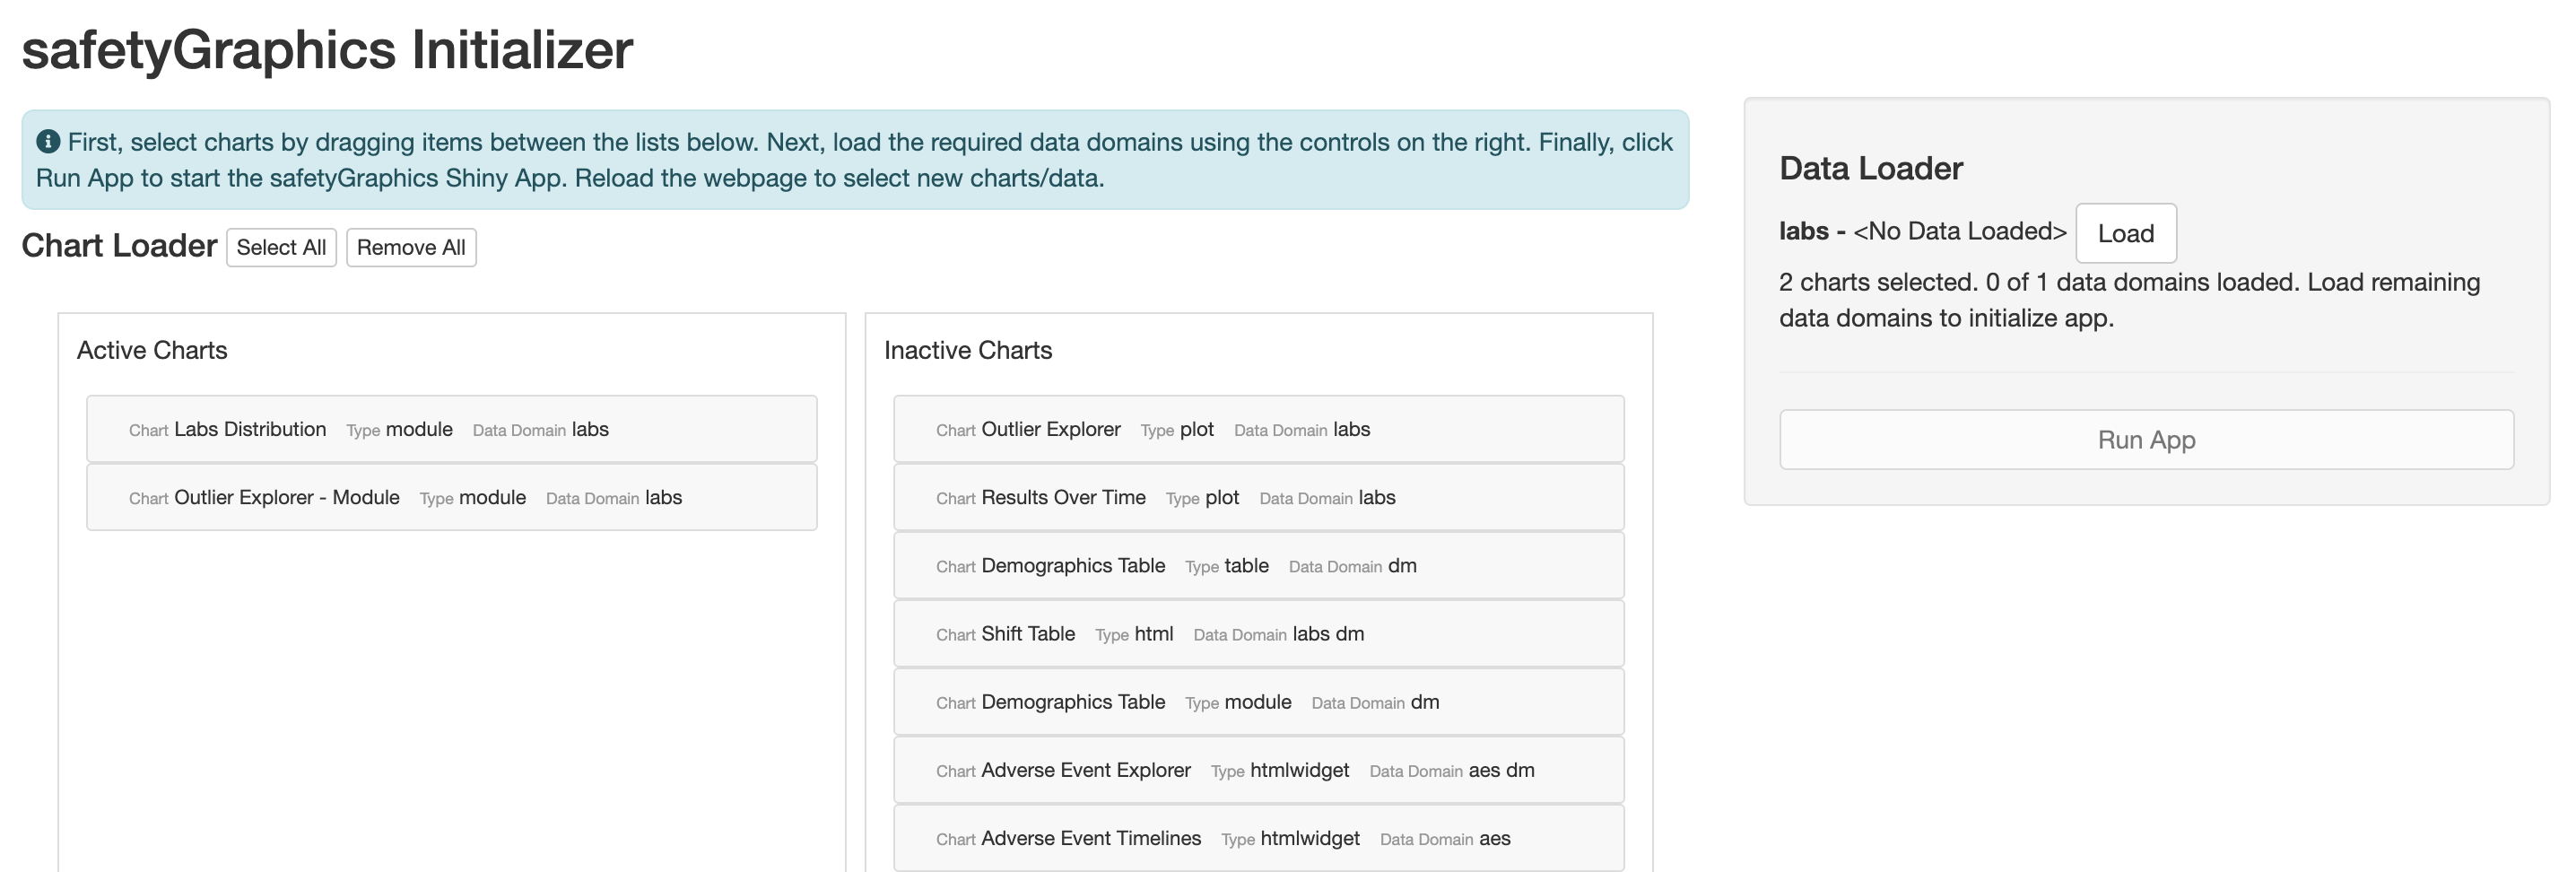
The app dynamically determines which data sets are required for the selected charts and updates the “Data Loader” UI when the charts selection changes. Below, we’ve selected 2 charts from the labs domain - so the other data domains are automatically hidden.
Once you’ve picked charts, click the “Load” buttons in the “Data Loader” section to select data files for each domain. Data is loaded using the import functionality from the {datamods} package which allows you to select data loaded in your R session or load data files directly from your file system. datamods supports any file format that {rio} can handle including text files, Excel, SAS and SPSS format.
Once you’ve loaded files for all of the active data domains, the “Run App” button will become active. Click it to initialize the app.
Passing data to safetyGraphicsApp()
You can also initialize the app with custom data directly from the R console. The basic workflow is as follows:
- Load your data in to the R session
- Save your data as a named list. The name of each list item should correspond to a safetyGraphics data domain.
- Run
safetyGraphicsApp()using thedomainDatato pass the list of data frames.
Here is a simple example that starts the app with SDTM data from the safetyData library:
library(safetyData)
sdtm <- list(
    dm=safetyData::sdtm_dm,
    aes=safetyData::sdtm_ae,
    labs=safetyData::sdtm_lb
)

safetyGraphics::safetyGraphicsApp(domainData=sdtm)
This example and other use cases are described in cookbook vignette.
Large Data sets
Use the maxFileSize option to load data sets larger than 5 mb in safetyGraphicsInit (e.g. safetyGraphicsinit(maxFileSize=100)). safetyGraphicsApp() does not have size limits for data files, but note that large data (>100 mb) may cause performance issues.
Additional Resources
Several additional vignettes are available for more advanced topics:
- Chart Configuration Vignette - details about the charting process including technical specifications and step-by-step instructions
- Cookbook Vignette - a series of examples showing how to initialize the safetyGraphics Shiny app in different scenarios
- Technical FAQ Vignette - vignette discussing security, validation and other technical issues
The {safetyGraphics} app is maintained by the Interactive Safety Graphics (ISG) subteam of the ASA Biopharm-DIA Safety Working Group. You can learn more about the team and find links to recent presentations and publications at our home page.
Appendix 1 - Initialization code
We suggest running the app in RStudio with R version 4.0 or higher. The following code installs the {safetyGraphics} package and initializes the app demo:
install.packages('safetyGraphics')
library(safetyGraphics)
safetyGraphicsApp()
Or to use the initialization workflow:
install.packages('safetyGraphics')
library(safetyGraphics)
safetyGraphicsInit()
Or you can install the most recent development version of {safetyGraphics} and the companion package {safetyCharts} directly from GitHub:
install.packages("devtools")
library(devtools)
devtools::install_github("safetyGraphics/safetyGraphics")
library(safetyGraphics)
devtools::install_github("safetyGraphics/safetyCharts")
library(safetyCharts)
safetyGraphicsApp() #or safetyGraphicsInit()
Appendix 2 - Minimum Data Requirements
Since the safetyGraphics framework supports adding custom charts (that may have custom settings), there are no universal data requirements for the app. However, the charts included by default version of the app are built to share requirements whenever possible. These requirements are captured in an included metadata file called safetyGraphics::meta.
The most basic requirements for the 3 default domains are:
-
Lab results (
labs) domain - Expects one record per person per visit per lab measurement with columns for: Participant ID, lab result, lab name, lower limit of normal, upper limit of normal, study day, study visit (numeric), study visit (character). SeesafetyGraphics::meta %>% filter(domain=="labs")for additional details and optional columns used by some charts. -
Adverse Event (
aes) domain - Expects one record per adverse event with columns for: Participant ID, AE Sequence, Study Day, AE Start day, AE end day, AE preferred term and AE body system. SeesafetyGraphics::meta %>% filter(domain=="aes") -
Demographics (
dm) domain - Expects one record per person with columns for: Participant ID, Sex, Race, Age and Study Treatment (optional) . SeesafetyGraphics::meta %>% filter(domain=="dm")for additional details.